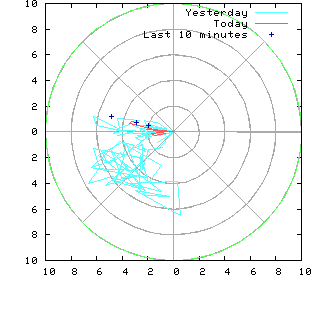
This wind plot shows wind strength and direction for today and yesterday.
North is at the top, east at the right, etc., like a map. A dot near the top means the wind was blowing FROM the north. If there were no wind, it would be plotted as a dot in the centre. Dots further away from the centre show stronger winds. The green circle is 10 km/hour.
Each point shows an average for the wind, taken over 10 minutes. The points for yesterday and today have been joined by lines - pale blue for yesterday, red for today. Also, to show what's happening now, the last ten minutes' wind readings are shown as dark blue + signs. These are not averages, but ten readings, one minute apart.
Things to look for: The wind is often calm at night, so the red line often starts in the centre of the plot.
Renmark weather this minute / today / this week / older records
Weather index / Riverland Internet home / Last updated Wednesday, 04-Feb-2026 04:56:01 ACDT